pacman::p_load(knitr, tidyverse, tidygraph, igraph, ggraph, ggiraph, DT, ggtext, scales)Data Exploration and Visualization
In this part we will visualize the network and look for temporal and structural patterns.
We will use the inferences we make to create the Shiny App.
For the purposes of this this investigation, we will focus on the network of the SouthSeafood Express Corp.
1 Setup
1.1 Loading Packages
Package List
We will use the following packages.
knitr - For better table displays
tidyverse - Data science tools
tidygraph - For graph manipulations
igraph - Contains functions for network analysis
ggraph - For plotting network data
ggiraph - Interactive plots
DT - interactive tables
ggtext - Tools for text formatting
scales - Extends functions to operate on
ggplot2scales. Useful for wrapping text and formatting numbers in axes.
1.2 Loading the data
We will load the supernetwork data from the RDS we prepared during data preparation.
supernetwork <- readRDS("data/rds/supernetwork.rds")2 Extracting the subnetwork
2.1 Extracting connected network
We will use the extract_subnetwork function to extract the subnetwork within distance = 3 of SouthSeafood Express Corp.
sec_network <- supernetwork %>% extract_subnetwork("SouthSeafood Express Corp", distance = 3)Let us check the node and edge counts to confirm if this is a smaller graph.
vcount(sec_network)[1] 12ecount(sec_network)[1] 162.2 Most active years
The edges of the subnetwork contains relationship from all-time.
We will prioritize our investigation by activity. In order to do this, we need to identify the years with the most number of transactions for the network.
Code
sec_edges <- sec_network %>% as_data_frame(what="edges")

start_df <- sec_edges %>%
  mutate(year = lubridate::year(start_date)) %>%
  group_by(year) %>% summarize(count = n())

end_df <- sec_edges %>%
  mutate(year = lubridate::year(end_date)) %>%
  group_by(year) %>% summarize(count = n())

txns_per_year <- start_df %>% rbind(end_df) %>%
  group_by(year) %>% summarize(count = sum(count)) %>%
  filter(!is.na(year))

ggplot(txns_per_year, aes(x = year, y = count, fill = year)) +
  geom_bar(stat = "identity",
           width = 0.75,
           fill = ifelse(txns_per_year$year == 2035, "blue", "grey50")) +
  geom_text(
    aes(label = count), nudge_y = 0.35, size = 4.5,
    family = "Roboto Condensed", fontface = "bold") +
  scale_x_continuous(n.breaks = 8) +
  scale_y_continuous(breaks = breaks_pretty()) +
  labs(x = "Year", y = "Number of transactions") +
  ggtitle(
    "Yearly Network Transactions",
    "2035 is the the most active year for SouthSeafood Express Corp's network"
  ) +
  theme_minimal() +
  theme(
    text = element_text(family = "Roboto Condensed"),
    panel.grid.minor = element_blank(),
    axis.line = element_line(),
    axis.ticks = element_line(),
    plot.title = element_text(face = "bold"),
  )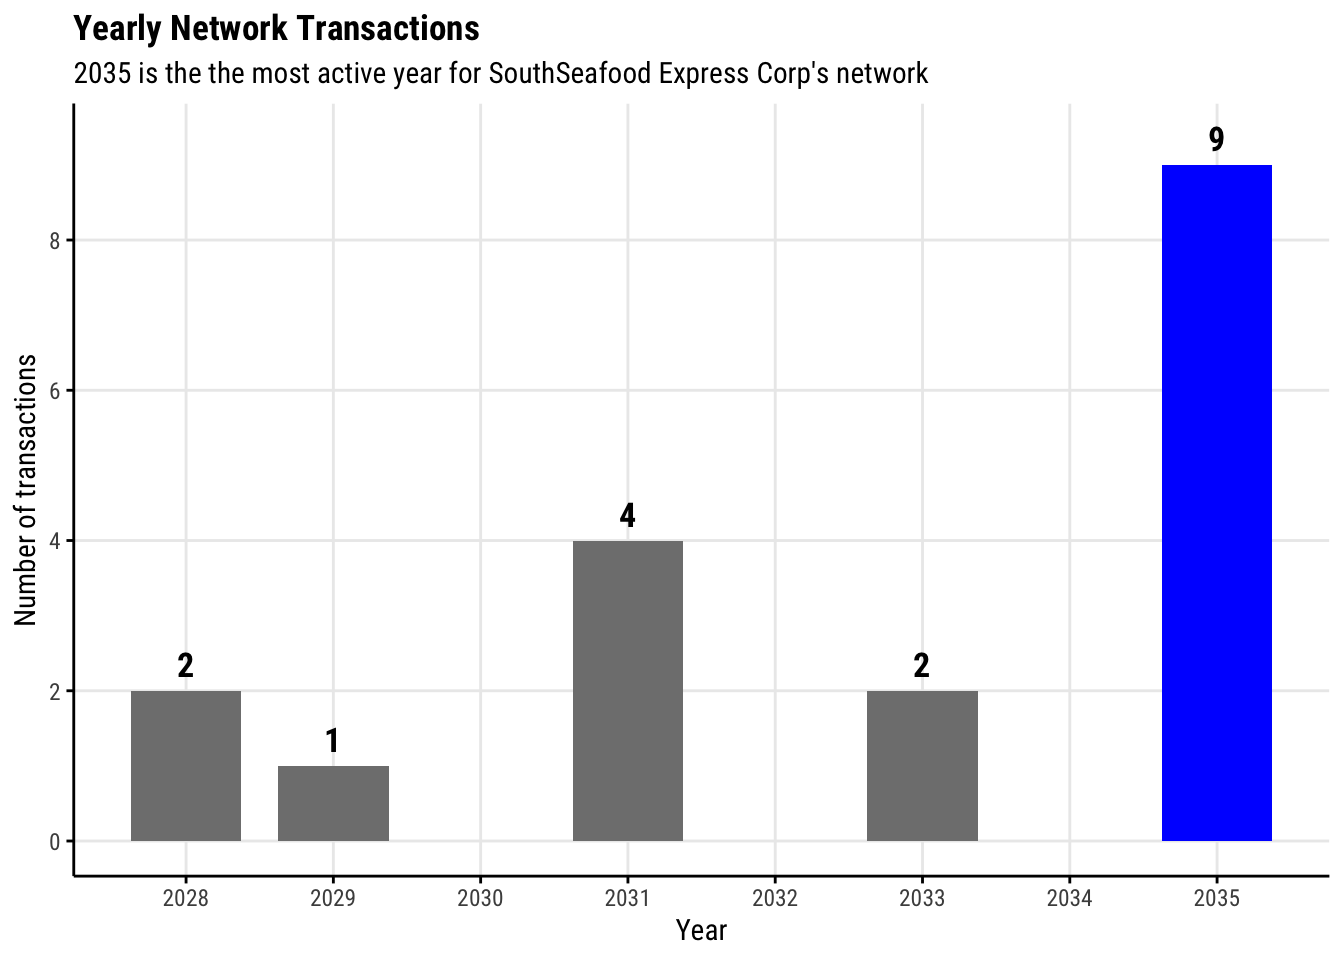
2035 is the year that has the most transactions. Let examine this year more closely.
Double counting
Take note that an edge may be counted twice as there are a maximum of 2 events per edge. One for starting the relationship and another for ending the relationship.
We will use an interactive datatable to investigate the transactions for this year.
sec_network %>%
  as_data_frame(what="edges") %>%
  filter((year(start_date) == 2035) | (year(end_date) == 2035)) %>%
  select(from, to, subtype, start_date, end_date) %>%
  arrange(start_date) %>%
  datatable()
Findings
2035 is a suspicious year for this network as there our many Shareholdership transactions that happened.
The most notable are in rows 4 and 8, which indicate a change in Shareholdership of SouthSeafood Express Corp from AguaLeska Transit N.V. to Tainamarine Fishing Co.
The first in this series of events is Liam Conti giving up the shareholdership of AguaLeska Transit N.V.
This is very suspicious as this can indicate that Liam Conti wants to distance himself from SouthSeafood Express Corp after the company was caught illegal fishing.
3 Visualizing the Network
While were able to derive some insights from the table, it can only give us a hint as to the time period that we should look at more closely.
To better see patterns in the network, we need to visualize it.
3.1 Plotting Function
We will use the function plot_fishing_relationships() to visualize the business relationships within the network:
Show MAPPINGS
MAPPINGS = list(
  # Available shapes: https://www.datanovia.com/en/blog/ggplot-point-shapes-best-tips/
  node_supertype_to_shape = c(
    "Person" = 24, # Triangle
    "Organization" = 21 # Circle
  ),
  # Color schemes
  # Colorblind pallettes from https://davidmathlogic.com/colorblind
  node_subtype_to_color = c(
    "Person" = "#44AA99",
    "CEO" = "#117733",
    "Company" = "#DDCC77",
    "FishingCompany" = "#88CCEE",
    "LogisticsCompany" = "#332288",
    "FinancialCompany" = "#AA4499",
    "NGO" = "#CC6677",
    "NewsCompany" = "#882255"
  ),

  edge_relationship_subtype_to_color = c(
    "WorksFor" = "#D81B60",
    "Shareholdership" = "#FFC107",
    "BeneficialOwnership" = "#004D40",
    "FamilyRelationship" = "#1E88E5"
  ),
  edge_power_subtype_to_color = c(
    "WorksFor" = "#D81B60",
    "HasShareholder" = "#FFC107",
    "OwnedBy" = "#004D40",
    "FamilyRelationship" = "#1E88E5"
  )
)
Show COMMON_THEME
COMMON_THEME = theme(
  text = element_text(family = "Roboto Condensed", color = "grey50"),
  plot.title = element_text(size = 12, margin = margin(b = 6), color = "grey25"),
  plot.subtitle = element_markdown(size = 8, margin = margin(b = 6), color = "grey50"),
  plot.margin = margin(2, 0, 0, 0, unit = "pt"),

  # Legend styles
  legend.position = "right",
  legend.location = "plot",
  legend.justification = "top",
  legend.direction = "vertical",
  legend.title = element_markdown(
    color = "grey25",
    face = "bold",
    size = unit(8, "pt")
  ),
  legend.text = element_text(size = unit(6, "pt"), vjust = 0.5),
  legend.box.spacing = unit(4, "pt"),
  legend.margin = margin(r = 6),
  legend.spacing.x = unit(2, "pt"),
  legend.spacing.y = unit(8, "pt"),
  legend.key.size = unit(12, "pt"),

  panel.border = element_rect(
    color = "grey50",
    fill = NA,
    linewidth = 0.5
  )
)
Show code for plot_fishing_relationships()
plot_fishing_relationships <- function(graph,
# Name of nodes to emphasize
emphasize_nodes = c(),
# Layout options
layout = "nicely",
title = NULL,
subtitle = NULL) {
set.seed(4231)
if(vcount(graph) == 0) {
return(NULL)
}
nodes <- as_data_frame(graph, what = "vertices")
g <- ggraph(graph, layout = layout) +
# Render nodes
geom_point_interactive(
aes(
x = x,
y = y,
# Replace ' as it causes tooltips to not render correctly in JS
data_id = sub("'", "'", name),
tooltip = sprintf("%s<br/>(%s)", sub("'", "'", name), subtype),
fill = subtype,
# To show people as triangle, organizations as circle
# See scale_shape_manual code below
shape = supertype,
),
alpha = nodes$included,
size = 7.5,
# Thicken border if emphasized
color = ifelse(nodes$name %in% emphasize_nodes, "black", "grey50"),
stroke = ifelse(nodes$name %in% emphasize_nodes, 1, 0.5),
) +
geom_node_text(
aes(label = alias),
family = "Roboto Condensed",
size = 2,
color = "white",
fontface = ifelse(nodes$name %in% emphasize_nodes, "bold", "plain"),
alpha = nodes$included,
) +
# Render edges. Use geom_edge fan so edges along the same path don't overlap
geom_edge_fan(
aes(
color = subtype,
filter = ifelse(included == 1, TRUE, FALSE)
),
strength = 0.5,
arrow = arrow(type = "closed", length = unit(2, "pt")),
end_cap = circle(3.2, "mm"),
start_cap = circle(3.2, "mm"),
alpha = 0.8
) +
scale_shape_manual(values = MAPPINGS$node_supertype_to_shape) +
scale_fill_manual(values = MAPPINGS$node_subtype_to_color) +
scale_edge_color_manual(values = MAPPINGS$edge_relationship_subtype_to_color) +
# Change legend names
labs(shape = "Node Supertypes",
fill = "Node Subtypes",
edge_color = "Edge Subtypes") +
# Make sure the plot is not clipped
scale_x_continuous(expand = expansion(mult = c(0.10, 0.10))) +
scale_y_continuous(expand = expansion(mult = c(0.10, 0.10))) +
# Style legend keys
guides(
shape = guide_legend(
override.aes = list(size = 3, fill = "blue"),
order = 1
),
fill = guide_legend(
override.aes = list(
size = 4,
shape = 22,
color = NA
),
order = 2,
),
edge_color = guide_legend(order = 3),
) +
ggtitle(title, subtitle) +
# Style graph
unset_graph_style() +
theme_graph(base_family = "Roboto Condensed",
plot_margin = margin(0)) +
COMMON_THEME
girafe(
ggobj = g,
width_svg = 6,
height_svg = 6 * 0.618,
options = list(
opts_tooltip(
css = paste0(
"background-color:black;color:white;",
"font-family:Roboto Condensed;font-size:10pt;",
"padding:4px;text-align:center;"
),
),
opts_sizing(rescale = TRUE),
opts_selection(type = "none"),
opts_zoom(min = 1, max = 5)
)
)
}3.2 Plotting the Network (distance = 3)
With the above function, we can plot the state of the network before and after 2035.
Code
sec_network %>%
  extract_network_snapshot("2034-12-31") %>%
  plot_fishing_relationships(
    emphasize_nodes = c("SouthSeafood Express Corp", "Liam Conti"),
    title = "SouthSeafood Express Corp's Network (distance = 3) on Dec 31, 2034",
    subtitle = "**Liam Conti** is the person ultimately in control of the company via **AguaLeska Transit N.V.**"
  )
Code
sec_network %>%
  extract_network_snapshot("2036-01-01") %>%
  plot_fishing_relationships(
    emphasize_nodes = c("SouthSeafood Express Corp", "Liam Conti"),
    title = "SouthSeafood Express Corp's Network (distance = 3) on Jan 1, 2036",
    subtitle = "Liam Conti **distanced** himself from the company while still maintaining some form of control through a series of companies."
  )
Findings
The visualization confirms our initial inference that Liam Conti distanced himself from SouthSeafood Express Corp after the discovery of illegal fishing.
It also reveals another beneficiary of this action, Fintan Park, who is also a beneficial owner of StitchtingMarine Shipping Company, which is the company who eventually holds the power over SouthSeafood Express Corp.
3.3 Plotting the Network (all connected nodes)
It is also important to look at the wider network if there are other suspicious changes and additional information related to Liam Conti’s actions.
Code
supernetwork %>%
  extract_subnetwork("SouthSeafood Express Corp") %>%
  extract_network_snapshot("2034-12-31") %>%
  plot_fishing_relationships(
    emphasize_nodes = c(
      "SouthSeafood Express Corp",
      "Liam Conti",
      "Nadia Conti",
      "Lena Conti-Park",
      "Fintan Park",
      "Nathan Conti",
      "Lemuel Conti",
      "Fabio Conti",
      "Samuel Conti"
      ),
    title = "SouthSeafood Express Corp's Full Network on Dec 31, 2034",
    subtitle = "Members of the **Conti Clan** are related to all fishing businesses in the network."
  )
Code
supernetwork %>%
  extract_subnetwork("SouthSeafood Express Corp") %>%
  extract_network_snapshot("2036-01-01") %>%
  plot_fishing_relationships(
    emphasize_nodes = c(
      "SouthSeafood Express Corp",
      "Liam Conti",
      "Nadia Conti",
      "Lena Conti-Park",
      "Fintan Park",
      "Nathan Conti",
      "Lemuel Conti",
      "Fabio Conti",
      "Samuel Conti",
      "The News Buoy"
      ),
    title = "SouthSeafood Express Corp's Full Network on Jan 1, 2036",
    subtitle = "The Conti Clan obtained control of a news company, **The News Buoy** in 2035."
  )
Findings
Looking at the wider network reveals that all the fishing companies in the network are under a control of a group of people, the Conti Clan. Although not formally related as family members in the graph, their family names indicate the relationship. Some influential people like Fintan Park are also part of the clan by marriage (e.g., to Lena-Conti Park).
Another suspicious event in 2035 is the clan’s acquisition of shareholdership in a news company, The News Buoy through Samuel Conti. This could be an effort to influence the narrative of SouthSeafood and the whole Conti Clan’s fishing activities.
4 Visualizing Influence
4.1 Calculating measures of centrality
To visualize influence, we first need to calculate the measures of centrality for each state of the network from before and after 2035.
sec_network_full <- supernetwork %>%
  extract_subnetwork("SouthSeafood Express Corp") %>%
convert_graph_to_power_flow()nodes_influence_before <- sec_network_full %>%
extract_network_snapshot('2034-12-31', delete = TRUE) %>%
mutate(
pagerank = centrality_pagerank(weights = E(.)$weight),
betweenness = centrality_betweenness(weights = E(.)$weight, normalized = TRUE)
) %>%
as_data_frame(what="vertices")
# Generate the graph for plotting
sec_influence_before <- sec_network_full %>%
extract_network_snapshot('2034-12-31') %>%
left_join(nodes_influence_before)
nodes_influence_before %>% arrange(name) %>% select(-name) %>% kable()| alias | supertype | subtype | product_services | included | pagerank | betweenness | |
|---|---|---|---|---|---|---|---|
| 4. SeaCargo Ges.m.b.H. | 4SGm | Organization | LogisticsCompany | Tuna, sword fish, bass, trout, and salmon, as well as offers shellfish, mollusks, crustaceans, sea vegetables, shrimp, lobster, squid, oysters, crabs, and clams, and other related seafood products | TRUE | 0.0398513 | 0.0019231 |
| 9. RiverLine CJSC | 9RC | Organization | Company | Unknown | TRUE | 0.0143016 | 0.0012821 |
| AguaLeska Transit N.V. | ATNV | Organization | FishingCompany | Fish and seafood products | TRUE | 0.0200629 | 0.0032051 |
| ArawakFish Cargo Ges.m.b.H. | ACGm | Organization | Company | Fish and seafood products | TRUE | 0.0219065 | 0.0038462 |
| BaringoAmerica Marine Ges.m.b.H. | BMGm | Organization | FishingCompany | Seafood | TRUE | 0.0108448 | 0.0000000 |
| Dry CreekRybachit Marine A/S | DCMA | Organization | FishingCompany | Fish, crustaceans and other seafood | TRUE | 0.0325836 | 0.0044872 |
| Dry CreekWorldLogistics Ltd. Liability Co | DCLL | Organization | LogisticsCompany | Fish and seafood products | TRUE | 0.0108448 | 0.0000000 |
| Eun-Ji Park | EJP | Person | Person | NA | TRUE | 0.0108448 | 0.0000000 |
| Fabio Conti | FC | Person | Person | NA | TRUE | 0.0714647 | 0.0000000 |
| Fintan Park | FP | Person | Person | NA | TRUE | 0.0435924 | 0.0000000 |
| FlounderLeska Marine BV | FMB | Organization | FishingCompany | Albacore, Alfonsino, Barramundi, Bass, Black Cod, Blue Cod, Bluenose, Caviar, Flounder, Groper, Gurnard, John Dory, Kingfish, Ling Kingclip, Lobster, Mahi, Ocean Trout, Opah Moonfish, Tuna | TRUE | 0.0108448 | 0.0000000 |
| GvardeyskAmerica Shipping Plc | GSP | Organization | Company | Shipping services | TRUE | 0.0589632 | 0.0192308 |
| Harvey Janus | HJ | Person | Person | NA | TRUE | 0.0166061 | 0.0000000 |
| HomabayMarine Carriers N.V. | HCNV | Organization | Company | Fish, crustaceans and other seafood | TRUE | 0.0161452 | 0.0025641 |
| James Bell | JB | Person | Person | NA | TRUE | 0.0200629 | 0.0000000 |
| KambalaSea Freight Inc | KFI | Organization | Company | Fish and seafood products | TRUE | 0.0219065 | 0.0025641 |
| KisumuSeafoodBrothers Ltd | KL | Organization | FishingCompany | Fresh and frozen seafood | TRUE | 0.0357336 | 0.0057692 |
| Lemuel Conti | LC | Person | Person | NA | TRUE | 0.0963356 | 0.0000000 |
| Lena Conti-Park | LCP | Person | Person | NA | TRUE | 0.0108448 | 0.0000000 |
| Liam Conti | LC | Person | Person | NA | TRUE | 0.0299945 | 0.0000000 |
| Maacama Ocean Worldwide LLC | MOWL | Organization | FishingCompany | Fish and seafood products | TRUE | 0.0108448 | 0.0000000 |
| Nadia Conti | NC | Person | Person | NA | TRUE | 0.0108448 | 0.0000000 |
| NamRiver Transit A/S | NTAS | Organization | LogisticsCompany | Fish and seafood products | TRUE | 0.0609635 | 0.0179487 |
| Nathan Conti | NC | Person | Person | NA | TRUE | 0.0530417 | 0.0000000 |
| NyanzaRiver Worldwide AS | NWA | Organization | FishingCompany | Fish and seafood products | TRUE | 0.0343217 | 0.0006410 |
| Oka Charter Boat Transport OJSC | OCBT | Organization | Company | Sea and coastal water transportation and other related shipping activities | TRUE | 0.0108448 | 0.0000000 |
| Oka Seafood Shipping Ges.m.b.H. | OSSG | Organization | FishingCompany | Fish and fish products (fresh and frozen seafood and other aquatic products, and canned and cured fish and seafood) | TRUE | 0.0163756 | 0.0019231 |
| OranjestadCreek Express Sagl | OES | Organization | Company | Fish and seafood products | TRUE | 0.0292810 | 0.0051282 |
| Rafael Sanchez | RS | Person | Person | NA | TRUE | 0.0155335 | 0.0000000 |
| RechFish Freight Plc | RFP | Organization | LogisticsCompany | Freight trucking and other related transportation services | TRUE | 0.0108448 | 0.0000000 |
| SamakaDredgeTransport OJSC | SO | Organization | Company | Sea and coastal water transportation and other related shipping activities | TRUE | 0.0108448 | 0.0000000 |
| Samuel Conti | SC | Person | Person | NA | TRUE | 0.0108448 | 0.0000000 |
| Sanaa El-Amin | SEA | Person | Person | NA | TRUE | 0.0108448 | 0.0000000 |
| SavanetaCreek Solutions NV | SSN | Organization | LogisticsCompany | Shipping, freight trucking and other related transportation services | TRUE | 0.0202260 | 0.0038462 |
| ScaniaSeafood Holdings Ltd. Liability Co | SHLL | Organization | FishingCompany | Marine fishing | TRUE | 0.0108448 | 0.0000000 |
| SouthLeska Worldwide AS | SWA | Organization | FishingCompany | Fish and seafood products | TRUE | 0.0251699 | 0.0006410 |
| SouthSeafood Express Corp | SEC | Organization | FishingCompany | Fishing and other related activities | TRUE | 0.0108448 | 0.0000000 |
| StichtingMarine Shipping Company | SSC | Organization | FishingCompany | Fish and seafood products | TRUE | 0.0212151 | 0.0064103 |
| SumacAmerica Transport GmbH & Co. KG | STGC | Organization | LogisticsCompany | Sea and coastal water transportation and other related shipping activities | TRUE | 0.0108448 | 0.0000000 |
| The News Buoy | TNB | Organization | NewsCompany | Publication of daily newspaper, website, and other news sources | TRUE | 0.0108448 | 0.0000000 |
| WestRiver Shipping KgaA | WSK | Organization | Company | Fish and seafood products | TRUE | 0.0108448 | 0.0000000 |
nodes_influence_after <- sec_network_full %>%
  extract_network_snapshot('2036-01-01', delete = TRUE) %>%
  mutate(
    pagerank = centrality_pagerank(weights = E(.)$weight),
    betweenness = centrality_betweenness(weights = E(.)$weight, normalized = TRUE)
  ) %>%
  as_data_frame(what="vertices")

# Generate the graph for plotting
sec_influence_after <- sec_network_full %>%
  extract_network_snapshot('2036-01-01') %>%
  left_join(nodes_influence_after)

nodes_influence_after %>% arrange(name) %>% select(-name) %>% kable()| alias | supertype | subtype | product_services | included | pagerank | betweenness | |
|---|---|---|---|---|---|---|---|
| 4. SeaCargo Ges.m.b.H. | 4SGm | Organization | LogisticsCompany | Tuna, sword fish, bass, trout, and salmon, as well as offers shellfish, mollusks, crustaceans, sea vegetables, shrimp, lobster, squid, oysters, crabs, and clams, and other related seafood products | TRUE | 0.0347480 | 0.0016611 |
| 9. RiverLine CJSC | 9RC | Organization | Company | Unknown | TRUE | 0.0125506 | 0.0011074 |
| ArawakFish Cargo Ges.m.b.H. | ACGm | Organization | Company | Fish and seafood products | TRUE | 0.0192244 | 0.0033223 |
| BaringoAmerica Marine Ges.m.b.H. | BMGm | Organization | FishingCompany | Seafood | TRUE | 0.0095170 | 0.0000000 |
| Dry CreekRybachit Marine A/S | DCMA | Organization | FishingCompany | Fish, crustaceans and other seafood | TRUE | 0.0278910 | 0.0038760 |
| Dry CreekWorldLogistics Ltd. Liability Co | DCLL | Organization | LogisticsCompany | Fish and seafood products | TRUE | 0.0095170 | 0.0000000 |
| Elise Hauser | EH | Person | Person | NA | TRUE | 0.0095170 | 0.0000000 |
| Eun-Ji Park | EJP | Person | Person | NA | TRUE | 0.0095170 | 0.0000000 |
| Fabio Conti | FC | Person | Person | NA | TRUE | 0.0638108 | 0.0000000 |
| Fintan Park | FP | Person | Person | NA | TRUE | 0.0454812 | 0.0000000 |
| FlounderLeska Marine BV | FMB | Organization | FishingCompany | Albacore, Alfonsino, Barramundi, Bass, Black Cod, Blue Cod, Bluenose, Caviar, Flounder, Groper, Gurnard, John Dory, Kingfish, Ling Kingclip, Lobster, Mahi, Ocean Trout, Opah Moonfish, Tuna | TRUE | 0.0095170 | 0.0000000 |
| GvardeyskAmerica Shipping Plc | GSP | Organization | Company | Shipping services | TRUE | 0.0517440 | 0.0166113 |
| Harvey Janus | HJ | Person | Person | NA | TRUE | 0.0154003 | 0.0000000 |
| HomabayMarine Carriers N.V. | HCNV | Organization | Company | Fish, crustaceans and other seafood | TRUE | 0.0133411 | 0.0022148 |
| James Bell | JB | Person | Person | NA | TRUE | 0.0145729 | 0.0000000 |
| KambalaSea Freight Inc | KFI | Organization | Company | Fish and seafood products | TRUE | 0.0192244 | 0.0022148 |
| KisumuSeafoodBrothers Ltd | KL | Organization | FishingCompany | Fresh and frozen seafood | TRUE | 0.0313586 | 0.0049834 |
| Lemuel Conti | LC | Person | Person | NA | TRUE | 0.0839766 | 0.0000000 |
| Lena Conti-Park | LCP | Person | Person | NA | TRUE | 0.0095170 | 0.0000000 |
| Liam Conti | LC | Person | Person | NA | TRUE | 0.0309248 | 0.0000000 |
| Maacama Ocean Worldwide LLC | MOWL | Organization | FishingCompany | Fish and seafood products | TRUE | 0.0095170 | 0.0000000 |
| Nadia Conti | NC | Person | Person | NA | TRUE | 0.0095170 | 0.0000000 |
| NamRiver Transit A/S | NTAS | Organization | LogisticsCompany | Fish and seafood products | TRUE | 0.0534994 | 0.0155039 |
| Namorna Transit Ltd | NTL | Organization | Company | Seafood products | TRUE | 0.0372032 | 0.0110742 |
| Nathan Conti | NC | Person | Person | NA | TRUE | 0.0476434 | 0.0000000 |
| NyanzaRiver Worldwide AS | NWA | Organization | FishingCompany | Fish and seafood products | TRUE | 0.0314088 | 0.0011074 |
| Oka Charter Boat Transport OJSC | OCBT | Organization | Company | Sea and coastal water transportation and other related shipping activities | TRUE | 0.0095170 | 0.0000000 |
| Oka Seafood Shipping Ges.m.b.H. | OSSG | Organization | FishingCompany | Fish and fish products (fresh and frozen seafood and other aquatic products, and canned and cured fish and seafood) | TRUE | 0.0143707 | 0.0016611 |
| OranjestadCreek Express Sagl | OES | Organization | Company | Fish and seafood products | TRUE | 0.0256959 | 0.0044297 |
| Rafael Sanchez | RS | Person | Person | NA | TRUE | 0.0143648 | 0.0000000 |
| RechFish Freight Plc | RFP | Organization | LogisticsCompany | Freight trucking and other related transportation services | TRUE | 0.0095170 | 0.0000000 |
| SamakaDredgeTransport OJSC | SO | Organization | Company | Sea and coastal water transportation and other related shipping activities | TRUE | 0.0095170 | 0.0000000 |
| Samuel Conti | SC | Person | Person | NA | TRUE | 0.0125506 | 0.0022148 |
| Sanaa El-Amin | SEA | Person | Person | NA | TRUE | 0.0095170 | 0.0000000 |
| SavanetaCreek Solutions NV | SSN | Organization | LogisticsCompany | Shipping, freight trucking and other related transportation services | TRUE | 0.0209122 | 0.0049834 |
| ScaniaSeafood Holdings Ltd. Liability Co | SHLL | Organization | FishingCompany | Marine fishing | TRUE | 0.0095170 | 0.0000000 |
| SouthLeska Worldwide AS | SWA | Organization | FishingCompany | Fish and seafood products | TRUE | 0.0233775 | 0.0011074 |
| SouthSeafood Express Corp | SEC | Organization | FishingCompany | Fishing and other related activities | TRUE | 0.0095170 | 0.0000000 |
| StichtingMarine Shipping Company | SSC | Organization | FishingCompany | Fish and seafood products | TRUE | 0.0427576 | 0.0132890 |
| SumacAmerica Transport GmbH & Co. KG | STGC | Organization | LogisticsCompany | Sea and coastal water transportation and other related shipping activities | TRUE | 0.0095170 | 0.0000000 |
| Tainamarine Fishing Co | TFC | Organization | FishingCompany | Fish and seafood products | TRUE | 0.0176065 | 0.0038760 |
| The News Buoy | TNB | Organization | NewsCompany | Publication of daily newspaper, website, and other news sources | TRUE | 0.0095170 | 0.0000000 |
| V. Miesel Shipping | VMS | Organization | Company | Seafood products | TRUE | 0.0325720 | 0.0099668 |
| WestRiver Shipping KgaA | WSK | Organization | Company | Fish and seafood products | TRUE | 0.0095170 | 0.0000000 |
4.2 Plotting function
We will use the function plot_centrality() to visualize the influence within the network:
Show code for plot_centrality()
plot_centrality <- function(graph,
# Column containing centrality measure, can be
# pagerank: for most powerful nodes
# betweeness: for power brokers
centrality_col,
# Name of nodes to emphasize
emphasize_nodes = c(),
# Layout options
layout = "nicely",
title = NULL,
subtitle = NULL) {
set.seed(4231)
if (!(centrality_col %in% c("pagerank", "betweenness"))) {
stop("Only pagerank and betweenness centralities are relevant in our analysis")
}
nodes <- as_data_frame(graph, what = "vertices")
edges <- as_data_frame(graph, what = "edges")
max_weight <- edges$weight %>% max()
min_weight <- edges$weight %>% min()
g <- ggraph(graph, layout = layout) +
# Render nodes
geom_point_interactive(
aes(
x = x,
y = y,
data_id = sub("'", "'", name),
tooltip = sprintf(
"%s (%s)<br/>Score: %0.5f",
sub("'", "'", name),
subtype,
.data[[centrality_col]]
),
# To show people as triangle, organizations as circle
# See scale_shape_manual code below
shape = supertype,
# Get centrality measures from a column
fill = .data[[centrality_col]],
size = .data[[centrality_col]],
),
alpha = nodes$included,
# Thicken border if emphasized
color = ifelse(nodes$name %in% emphasize_nodes, "black", "grey50"),
stroke = ifelse(nodes$name %in% emphasize_nodes, 1, 0.5),
) +
geom_node_label(
aes(label = alias),
family = "Roboto Condensed",
size = 2,
color = alpha("black", nodes$included),
fontface = ifelse(nodes$name %in% emphasize_nodes, "bold", "plain"),
alpha = nodes$included
) +
# Render edges. Use geom_edge fan so edges along the same path don't overlap
geom_edge_fan(
aes(
color = subtype,
edge_width = weight,
filter = ifelse(included == 1, TRUE, FALSE)
),
strength = 0.5,
arrow = arrow(type = "closed", length = unit(2, "pt")),
end_cap = circle(1.6, "mm"),
start_cap = circle(1.6, "mm"),
alpha = 0.8
) +
scale_shape_manual(values = MAPPINGS$node_supertype_to_shape) +
scale_edge_color_manual(values = MAPPINGS$edge_power_subtype_to_color) +
# Centrality visualization
scale_fill_gradient(
high = ifelse(centrality_col == "pagerank", "blue", "orange"),
low = "white"
) +
scale_size_continuous(range = c(3, 12), guide = FALSE) +
# Make sure edge widths are consistent across diff graphs
scale_edge_width(
range = c(min_weight * 0.2, max_weight * 0.2),
guide = "none"
) +
# Change legend names
labs(
fill = ifelse(
centrality_col == "pagerank",
"PageRank Score",
"Betweenness Score"
),
shape = "Node Supertypes",
edge_color = "Edge Subtypes"
) +
# Make sure the plot is not clipped
scale_x_continuous(expand = expansion(mult = c(0.10, 0.10))) +
scale_y_continuous(expand = expansion(mult = c(0.10, 0.10))) +
# Style legend keys
guides(
shape = guide_legend(
override.aes = list(
size = 3,
fill = "blue"
),
order = 1
),
edge_color = guide_legend(order = 2),
fill = guide_colorbar(order = 3)
) +
ggtitle(title, subtitle) +
# Style graph
unset_graph_style() +
theme_graph(base_family = "Roboto Condensed",
plot_margin = margin(0)) +
COMMON_THEME
girafe(
ggobj = g,
width_svg = 6,
height_svg = 6 * 0.618,
options = list(
opts_tooltip(
css = paste0(
"background-color:black;color:white;",
"font-family:Roboto Condensed;font-size:10pt;",
"padding:4px;text-align:center;"
),
),
opts_sizing(rescale = TRUE),
opts_selection(type = "none"),
opts_zoom(min = 1, max = 5)
)
)
}4.3 Visualizing Power Holders
We will use the plotting function to plot the power holders.
Code
sec_influence_before %>%
  plot_centrality(
    centrality_col = "pagerank",
    emphasize_nodes = "SouthSeafood Express Corp",
    title = "SouthSeafood Express Corp's Full Network on Dec 31, 2034",
    subtitle = "**Lemuel Conti** and other members of the Conti clan hold the most power in the network."
  )
Nodes List
Code
sec_influence_before %>%
  as_data_frame(what = "vertices") %>%
  filter(included == 1) %>%
  arrange(-pagerank) %>%
  select(name, subtype, pagerank) %>%
  mutate(pagerank = round(pagerank, 3)) %>%
  datatable(rownames = FALSE)
Code
sec_influence_after %>%
  plot_centrality(
    centrality_col = "pagerank",
    emphasize_nodes = "SouthSeafood Express Corp",
    title = "SouthSeafood Express Corp's Full Network on Jan 1, 2036",
    subtitle = "There is little no no change in influence as power holders of the Conti Clan members."
  )
Nodes List
Code
sec_influence_after %>%
  as_data_frame(what = "vertices") %>%
  filter(included == 1) %>%
  arrange(-pagerank) %>%
  select(name, subtype, pagerank) %>%
  mutate(pagerank = round(pagerank, 3)) %>%
  datatable(rownames = FALSE)
Findings
The actions of the Conti Clan to distance themselves from SouthSeafood Express Corp has little to no impact to their power over the system.
Liam Conti’s power wasn’t impacted much even when his company, AguaLeska Transit N.V., closed as a result of this series of events. Have a business network like the Conti Clan’s lead to cooperation to maintain control, which can make it more difficult to crack down on illegal fishing in this network.
4.4 Visualizing Power Brokers
We will use the plotting function to plot the power brokers.
Code
sec_influence_before %>%
  plot_centrality(
    centrality_col = "betweenness",
    emphasize_nodes = "SouthSeafood Express Corp",
    title = "SouthSeafood Express Corp's Full Network on Dec 31, 2034",
    subtitle = "Companies controlled by the Conti Clan are the power brokers in the network."
  )
Nodes List
Code
sec_influence_before %>%
  as_data_frame(what = "vertices") %>%
  filter(included == 1) %>%
  arrange(-betweenness) %>%
  select(name, subtype, betweenness) %>%
  mutate(betweenness = round(betweenness, 3)) %>%
  datatable(rownames = FALSE)
Code
sec_influence_after %>%
  plot_centrality(
    centrality_col = "betweenness",
    emphasize_nodes = "SouthSeafood Express Corp",
    title = "SouthSeafood Express Corp's Full Network on Jan 1, 2036",
    subtitle = "**StichtingMarine Shipping Company**'s influence increased as provides the only connection of the Contis to SouthSeafood Express Corp."
  )
Nodes List
Code
sec_influence_after %>%
  as_data_frame(what = "vertices") %>%
  filter(included == 1) %>%
  arrange(-betweenness) %>%
  select(name, subtype, betweenness) %>%
  mutate(betweenness = round(betweenness, 3)) %>%
  datatable(rownames = FALSE)
Findings
The influence of StichtingMarine Shipping Company as a power broker increased after “hiding” SouthSeafood Express Corp behind a series of companies. This is because StichtingMarine Shipping Company is the only connection of the Conti Clan to SouthSeafood Express Corp.